






Table of Contents:
Lean IT teams rarely have the luxury of a dedicated monitoring specialist, yet they are still expected to catch problems before anyone else notices. Many organizations end up stitching together several narrow tools just to get a full picture of their infrastructure, which adds cost and complexity instead of reducing it. Network monitoring software that covers network, server, cloud, and application layers in one place changes that equation, and PRTG Network Monitor is built around exactly that premise.
Why Organizations Replace Multiple Monitoring Tools with PRTG Network Monitor
Many IT departments historically ran separate systems for network devices, servers, and applications, then tried to reconcile the data manually. One customer noted needing three different monitoring systems, SolarWinds, Cacti, and SNMPC, just to get an overview of all systems and devices, and none of them offered mobile apps. Switching to PRTG Network Monitor let that team replace all three tools at once, which also cut down on duplicated licensing and maintenance effort. That kind of consolidation is the core reason organizations move away from fragmented monitoring stacks toward a single platform.
Auto-Discovery and Preconfigured Sensors: Getting Monitoring Live in Minutes
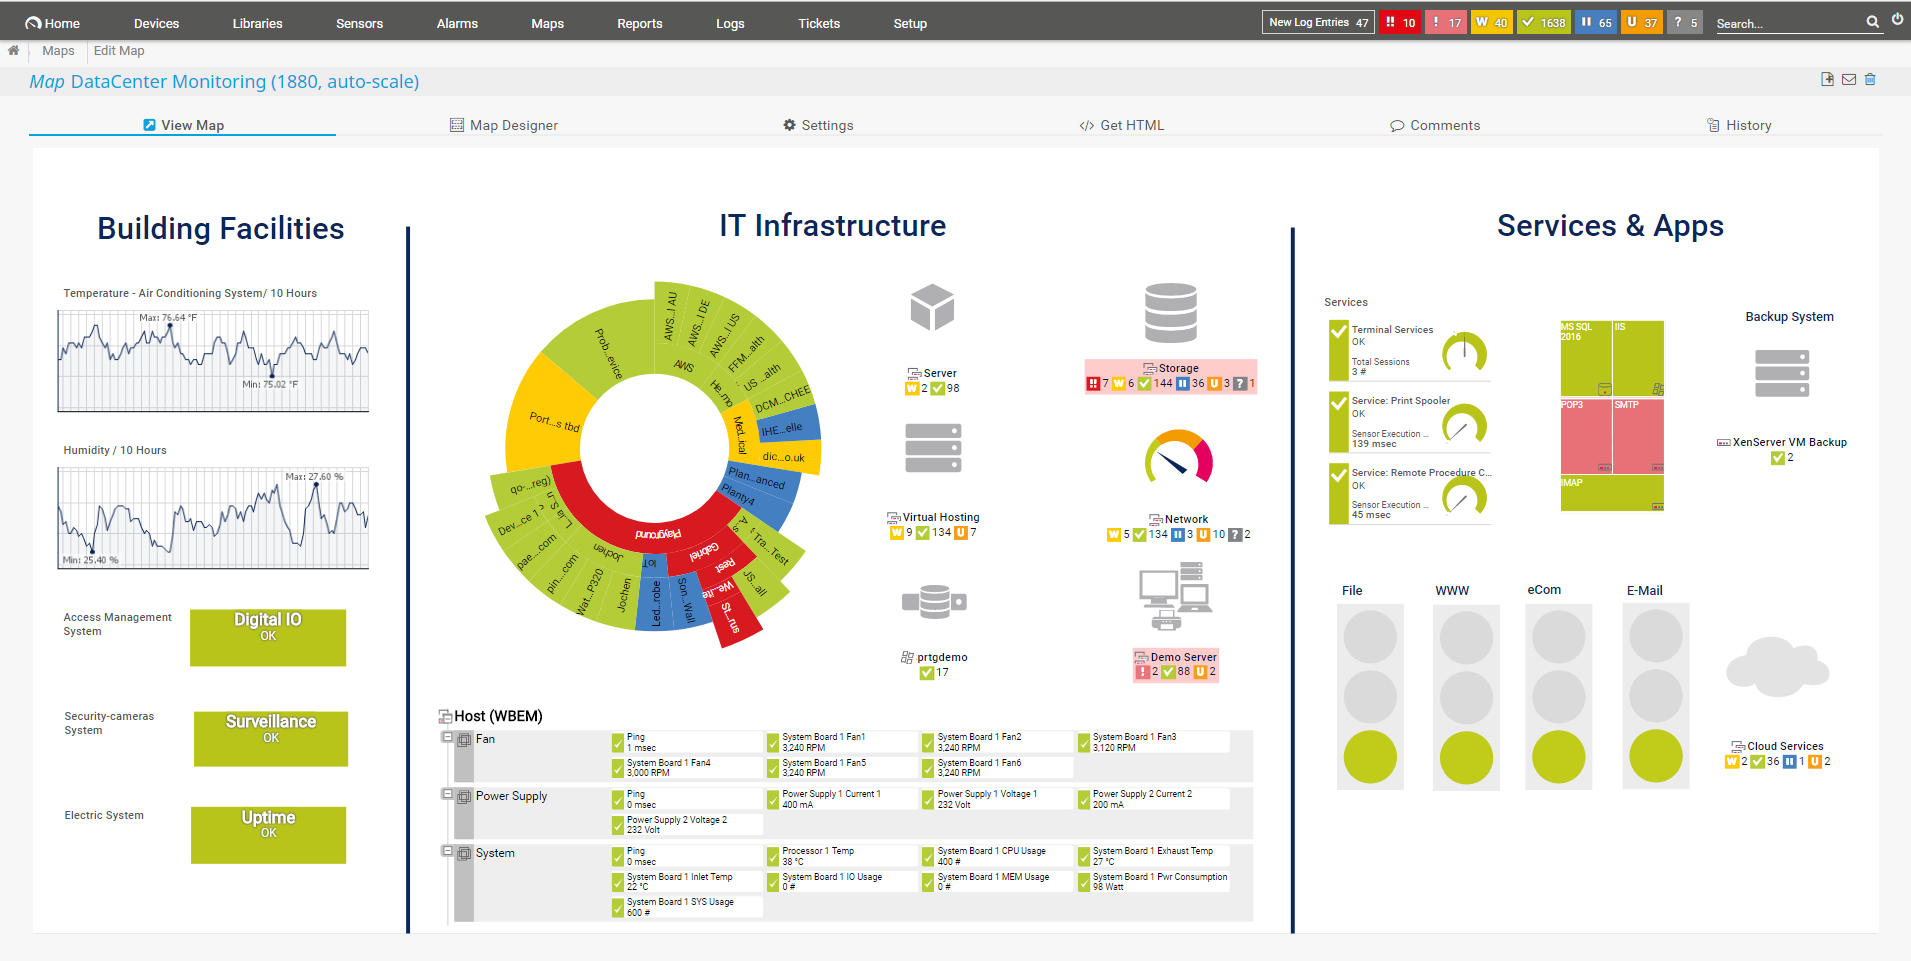
Paessler designed PRTG so that auto-discovery finds devices automatically across the environment. Preconfigured sensors then start collecting data immediately, without requiring scripting or a lengthy setup process. For small and mid-sized IT teams, the vendor states that hundreds of pre-configured sensors detect issues automatically, and deployment can happen in hours rather than weeks. This matters for teams without a dedicated monitoring specialist, since the interface is described as intuitive enough for an IT generalist while still offering deep customization and scripting for more demanding environments.
PRTG Network Monitor Across Network, Server, Cloud, and Database Environments
A single PRTG installation is built to monitor network infrastructure, servers, cloud services, and applications together, rather than requiring separate consoles for each layer. Paessler also extends this coverage into industrial settings, supporting health and condition monitoring of components like PLCs, IPCs, and control systems on the factory floor. Out-of-the-box support for industrial standards and protocols, including OPC UA, MQTT, and Modbus, lets the same network monitoring software reach into OT and IIoT environments alongside traditional IT. Healthcare is another example cited by the vendor, where PRTG’s healthcare IT sensors give visibility into devices such as MRTs, CTs, ultrasound devices, and video endoscopes.
Because the platform is vendor-agnostic, it is not limited to monitoring hardware from a single manufacturer. That breadth is part of what lets a single PRTG deployment replace multiple specialized tools that each monitored only one slice of the environment. In turn, teams get one data set to analyze instead of reconciling exports from several separate systems.
Distributed Monitoring and Scaling Without Operational Overhead
Organizations with branch offices, locations abroad, or services behind a firewall can extend PRTG’s reach using remote probes. Paessler offers two probe types, a classic remote probe for Windows systems and a multi-platform probe that runs on Linux/Unix, Docker, and other systems. These probes collect monitoring data autonomously and send it back to a central installation, which means remote infrastructure does not need to be exposed to the outside world.
This same remote probe capability also underpins Monitoring-as-a-Service offerings for managed service providers. An MSP can own a central PRTG installation and set up a remote probe at each customer site, including one probe per subnetwork where needed. All the collected data flows back into one place for analysis, alerting, and reporting, which keeps the operational model manageable even as the number of monitored sites grows.
PRTG Enterprise Monitor for Multi-Site and Large-Scale Infrastructure
Mid-market and decentralized organizations face a different scaling challenge than small teams, since they are adding sites, cloud workloads, and stakeholders who all want visibility. Paessler positions PRTG to scale from around 100 to thousands of sensors without requiring a dedicated monitoring team. Regional, plant, and site-based IT teams can deploy their own PRTG instance on their own timeline, monitoring warehouse networks, hospital wings, plant floors, or university campuses independently from corporate systems while still sharing data upward when needed.
Sensor-based licensing is sized for the actual local deployment, so a site only monitors what it needs to monitor. This approach gives distributed teams autonomy without waiting on central IT procurement or rollout schedules. It also avoids the complexity creep that can come from forcing every site onto one rigid, centrally managed configuration.
Unified Dashboards and Real-Time Alerts Across Vendor-Agnostic Infrastructure
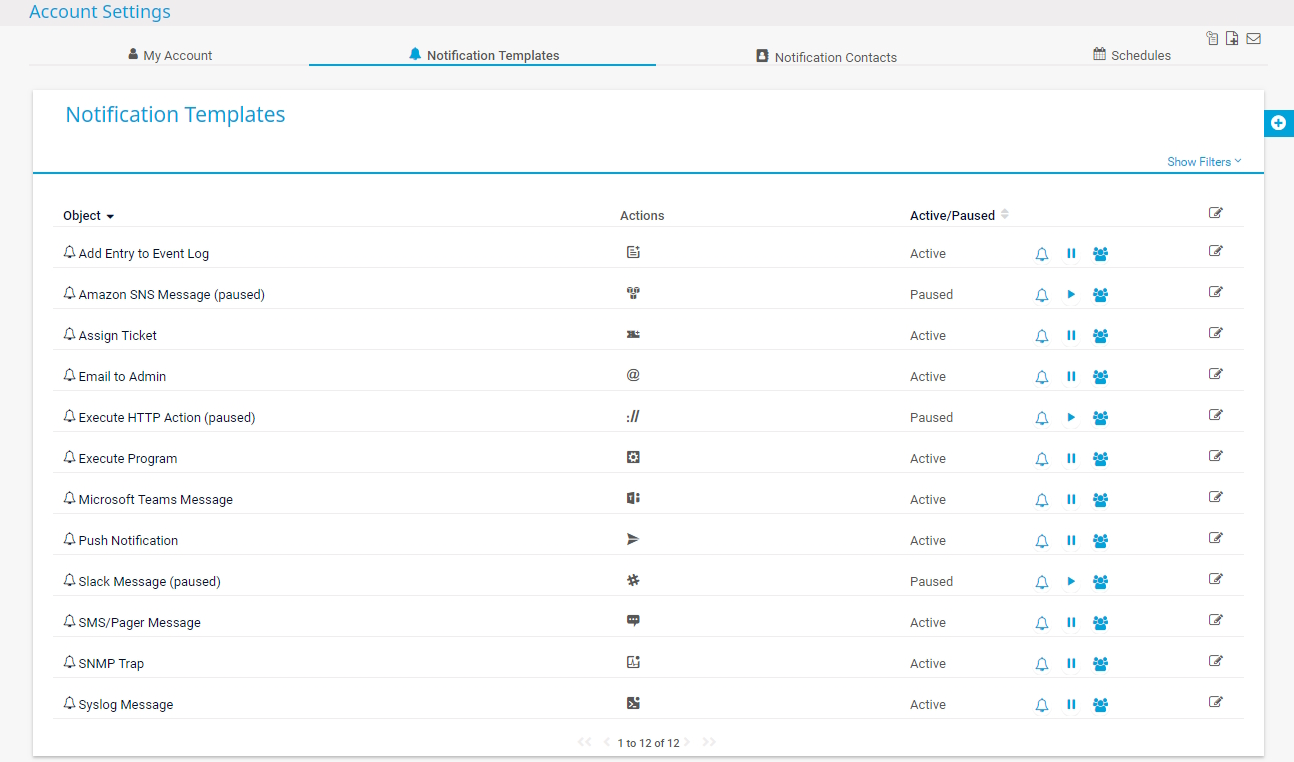
Once data from network devices, servers, cloud services, and industrial systems is flowing into PRTG, it surfaces through a single dashboard. That unified view is meant to eliminate the blind spots that appear when different tools only cover part of the environment. Threshold-based alerts then notify teams through email, SMS, or push notifications before issues escalate into outages that users would otherwise report first.
For mid-market IT leadership, Paessler also points to dashboards and reports that provide clear visibility without manual compiling. That reduces the recurring work of pulling data from separate systems into a single leadership report every quarter. The result is a monitoring setup that is, in the vendor’s words, built once rather than rebuilt every quarter.
- Auto-discovery and preconfigured sensors bring a new environment under monitoring without a lengthy manual setup process.
- A single installation covers network, server, cloud, and application layers instead of requiring one tool per layer.
- Remote probes, available for Windows or as a multi-platform option for Linux/Unix and Docker, extend monitoring to branch offices and firewalled services.
- Sensor-based licensing lets a site monitor only what it actually needs, which supports lean, independent site deployments.
- Unified dashboards bring IT, OT, and IIoT data together in a single pane of glass for teams managing converged environments.
- Threshold-based alerting notifies teams through email, SMS, or push before problems reach end users.
Across small IT teams, mid-market organizations, and large distributed enterprises, the common thread is consolidation without added operational weight. Network monitoring software that spans network, server, cloud, and industrial systems in one platform removes the need to juggle separate tools and separate dashboards. For teams trying to do more with limited headcount, that single point of visibility is the practical difference that matters.